


What will the Blue Wave leave behind after the election? Midterm history and the newly re-gerrymandered reality show us just how much a few points - and overperforming candidates - can impact House results.
After the last midterm in 2022, I wrote in The Bulwark about the funky wave that hit the incumbent party:
The odd truth about these midterms is that there actually was a red wave, both in who showed up (there were more Republican voters than Democrats) and in how people voted overall (Republicans will probably win the House popular vote by about
43 points).But not all waves break the same. There’s a type of wave called—seriously—a dumper. You get dumpers when waves go from deep to shallow water, and so curl and crash down without running up on shore. The 2022 red wave was bigger than expected—but it took a big dump when it hit moderate Democrats focused on persuasion …
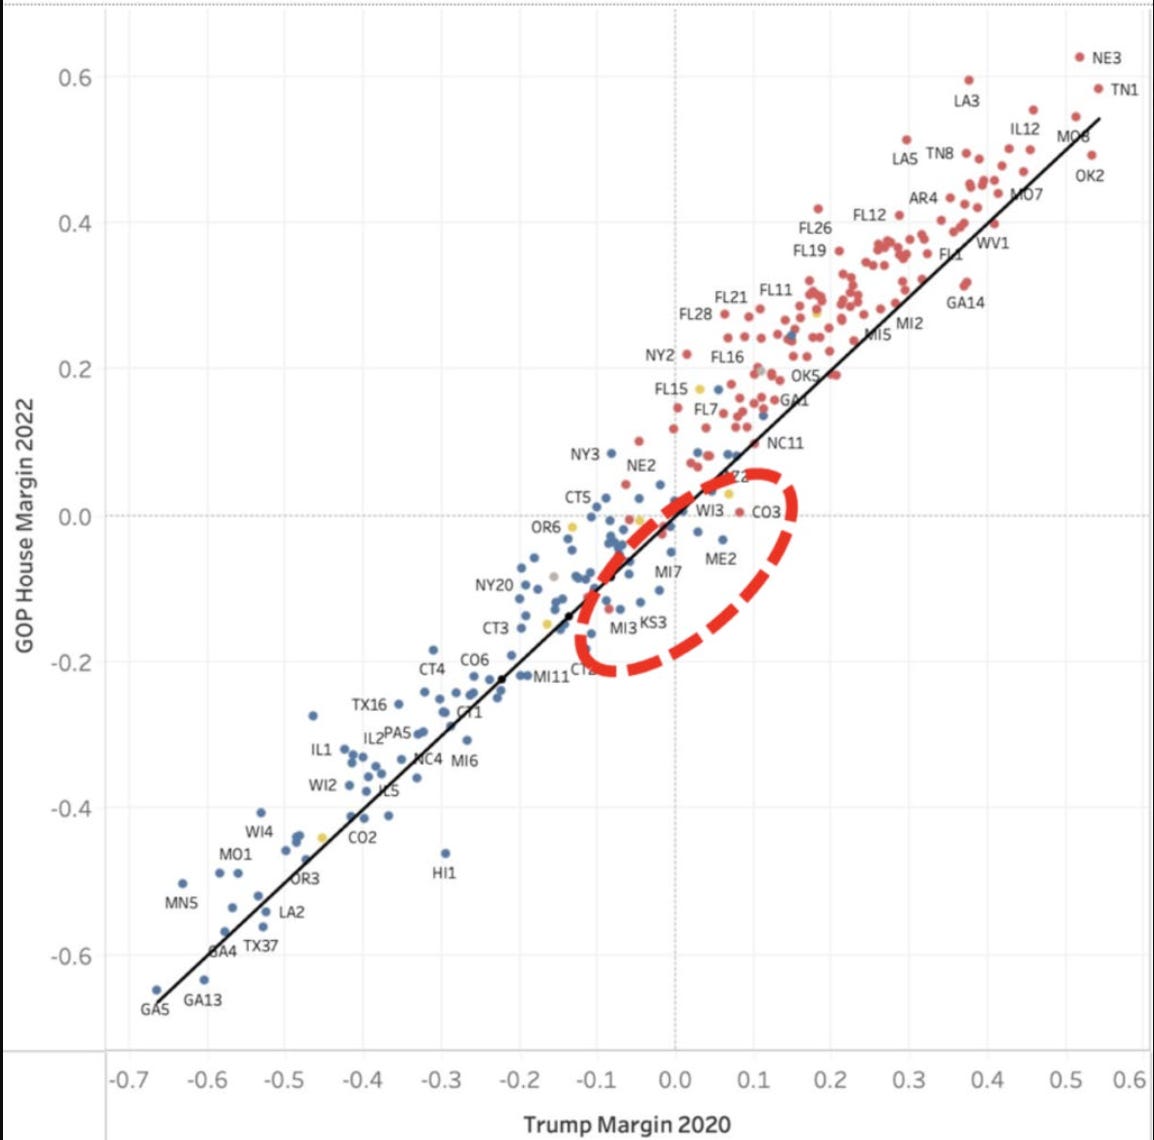
The best way to picture this dumper wave was circling the moderate Democratic outliers on this scatterplot chart from Patrick Ruffini, which showed an overwhelming number of districts voted more Republican for House in 2022 than they had in the previous presidential election in 2020. EXCEPT for a half-dozen outliers bunched right around the closest districts, contested by aggressive moderates like Jared Golden in ME-02 and Adam Frisch in CO-03 and Elissa Slotkin in MI-07.
For this midterm, the wave faces a different structure. GOP gerrymandering has reduced the share of seats that are narrowly contested and built a bulge of 62 districts favoring Republicans by 10 to 20 points. You can see it in this bar chart, again from Patrick Ruffini, which shows how many districts are at each level of partisanship from left (favoring Democrats by 80 points) to the right (favoring Republicans by 60 points).
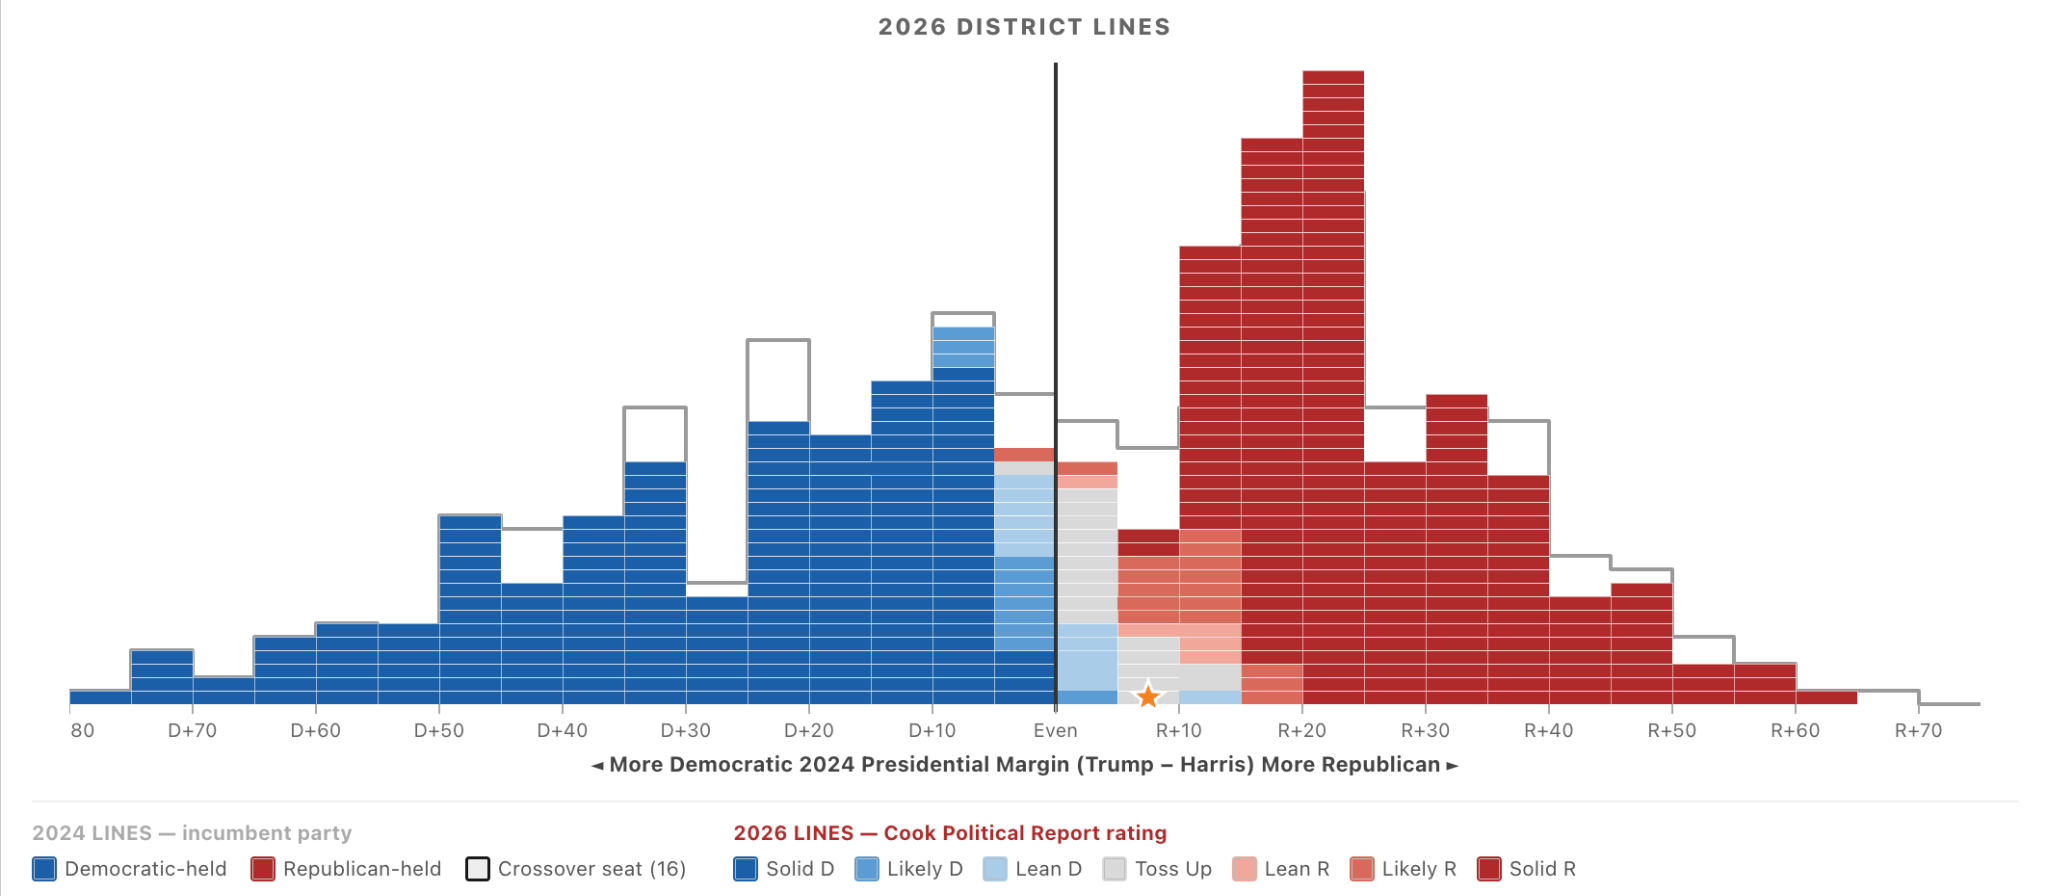
This has the visual bonus of literally looking like a medium-sized blue wave on the left coming up against a large red wall. The star on PA-10 (which was WelcomePAC’s top new target to put on the map last cycle) indicates the tipping point seat, at which Democrats would have a majority. Having a district that Trump won by 5.2% as the tipping point shows how advantageous the House map is for Republicans.
But the downside of the gerrymandering - stacking 62 usually-safe districts between R+10 and R+20 - is that if the waterline reaches that high, previously safe areas could get totally flooded.
How rare is that situation? Political hobbyists have been conditioned to view modern American politics as completely and utterly polarized. But the truth is that, as Nate Silver shows in this chart, this is not a hundred-year flood. Midterms have averaged 7.4 point swings, and at least 5 points every single midterm for the last two decades:
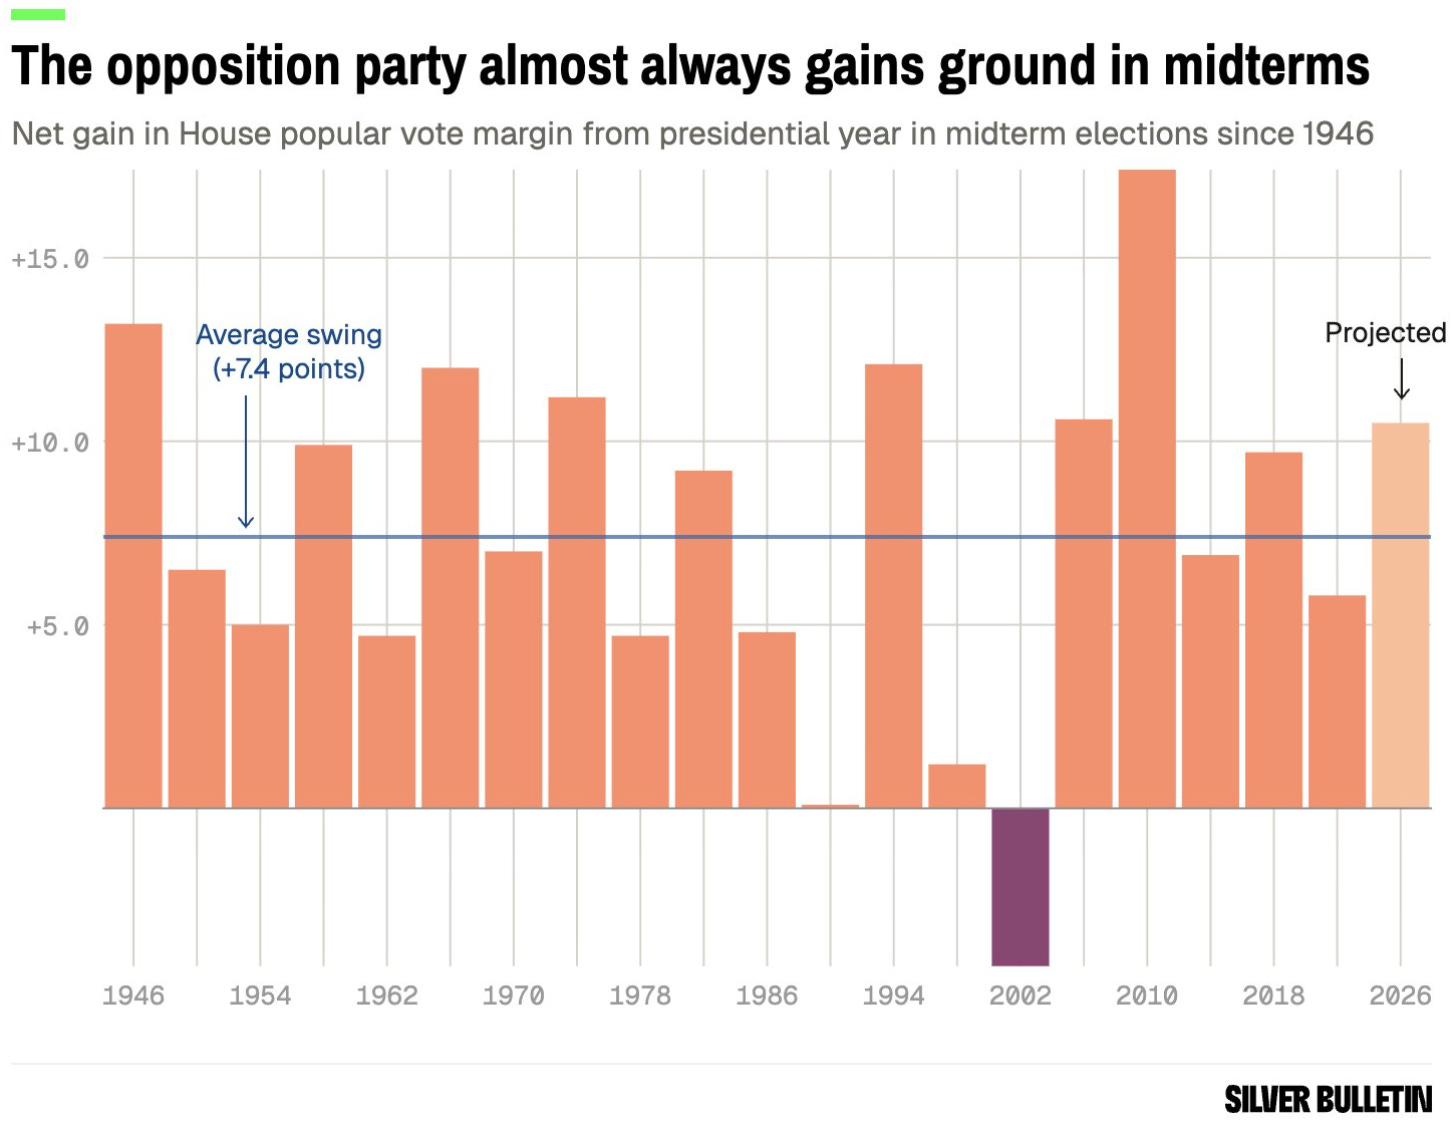
2026 may be a bigger blue wave than expected, but we’ve been calling out the potential for gerrymandering to backfire - a “dummymander” - for more than a year. And Republicans have already spent more than $70 million in their newly drawn districts.
As Marc Novicoff writes in The Atlantic, the same cliff that could flood Republicans means that a relatively normal systematic polling error could still turn back Democrats. Forecasters and markets have Democrats at roughly a 90% chance. But that’s where the 10% chance comes from. And why Democrats have to play through the tape.