


A few weeks back, Amy Walter at The Cook Political Report posted on social media that 2026 “feels like déjà vu” if one were to recall the contours of the 2006 midterm elections. She cited similarly low job approval ratings for Donald Trump now and George W. Bush then, similar generic ballot leads for Democrats in both cycles, unpopular Middle Eastern wars in Iran now versus Iraq then, and multiple members of the Republican majority in Congress being linked to sexual misconduct scandals.
Perry Bacon Jr. and Patrick Ruffini both recently noted in a piece in The New York Times that the political environment is worse for Republicans than in the 2018 midterms, and current data suggests that current trends signal a “2018-ish blowout in the House.” I’ve recently written about the comparisons of this midterm cycle to 2018 and argued Democrats should be doing better given the national environment is worse than it was for Republicans eight years ago.
Both comparisons seem apt: as Amy Walter notes, the landscape now is remarkably similar to 2006; the 2018 midterms are as close to an apples-to-apples comparison as you can get, given that it was the other midterm held in the middle of a Trump term.
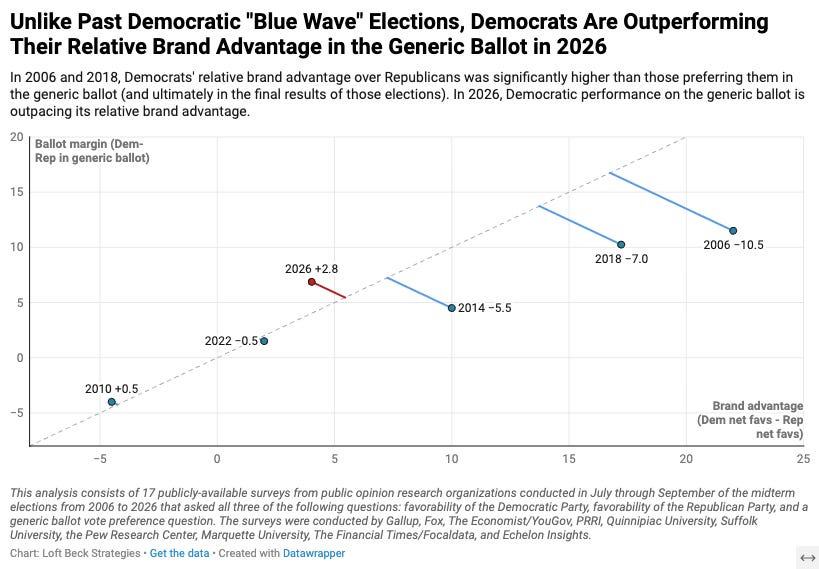
In one very specific way, however, 2026 is unlike any midterm since (and including) 2006: the current generic ballot polling for Democrats is overperforming their relative brand advantage versus Republicans, while in the 2018 and 2006 midterms, which saw significant Democratic victories, their performance underperformed their brand advantage. What does that mean, you ask? Well…
An Analysis of the Generic Ballot and Political Party Brands This Close to the Midterms from 2006–2026
For the purpose of this analysis1, I pulled together publicly-available surveys from the Q3 period of each midterm from 2006 to 2026 that asked all three questions: favorability of the Democratic Party, favorability of the Republican Party, and the generic ballot.2 Some brief notes of explanation for the chart below:
The x-axis is “relative brand advantage” (RBA), which calculates how much higher or lower favorability for the Democratic Party is compared to the Republican Party. For example, in 2006, the average net favorability of the Democratic Party was net +13 and the average net favorability of the Republican Party was net -9; thus, the RBA for Democrats was +22. In 2018, the average net favorability of the Democratic Party was net +1 and the average net favorability of the Republican Party was net -16; thus, the RBA for Democrats was +17. In Q3 of 2026, the average net favorability of the Democratic Party is net -13 and the average net favorability of the Republican Party is net -17; thus, the relative brand advantage for Democrats is just +4. This post does not dwell on the deterioration of the Democratic Party brand, of which I’ve also written about extensively and expressed many concerns about, but I will say this: despite having a narrow RBA, favorability of the Democratic Party dropping by a net 26 points over the last two decades is deeply problematic and should not be overlooked.
The y-axis is far simpler: it is just the net share on the generic ballot, where a number above zero indicates greater Democratic vote preference and a number below zero signals greater Republican vote preference.
When charted this way, Democrats have tended to underperform or equal their RBA in the generic ballot—and, ultimately, in the actual election results.
The Democratic “blue waves” of 2018 and 2006 were very similar to one another: the RBA was greater than +15 favoring Democrats, but voters in surveys of Q3 that year were pointing toward a seven-to-11-point national margin for Democrats in those respective midterms.
In 2014 and 2022—elections where Republicans prevailed but picked up fewer net seats in the House than we would normally expect in a wave election3—the Democratic RBA was still positive, but their generic ballot performance was slightly worse.
In 2010, the only midterm of the last six where Republicans had a narrow RBA, preference for Republicans in the generic ballot mirrored their RBA.
What makes 2026 polling different is that Democrats are currently overperforming their relative brand advantage on the generic ballot by a narrow four points, yet they lead on the generic ballot by seven points.4
Two High-Level Thoughts on What This Means
First, this may suggest the Democratic Party brand problems could be holding back their performance in generic ballot polling from being even stronger. After a recent New York Times/Siena national survey showed Democrats with an eight-point national lead, I wrote about how they should be doing better than at this point in 2018. In a survey from CNN/SSRS last week, more voters said Trump’s policies are worsening economic conditions in the country than said the same about Biden’s policies heading into the 2022 midterms. Independents and traditionally Democratic-aligned voting blocs such as younger voters, women, college graduates, and people of color, expressed the greatest levels of dissatisfaction.
This added to my belief that Democrats should be performing several points better than 2018. And, to be fair, there have also been several recent surveys showing double-digit Democratic leads nationally in the month of September, including from Emerson (D+11), Marist (D+12), Marquette (D+13), and YouGov (D+14). If the election ultimately produces results like these, that would better align with expectations relative to 2018 (though polling aggregators are currently much closer to the eight-point lead in the NYT/Siena survey).
If the national environment does end up being closer to D+8 (or weaker), my biggest question will be whether the lack of Democratic RBA and low net-favorability rating of the Democratic Party offset the higher antipathy felt toward Trump and Republicans.
Second, it’s possible the generic ballot may have a wider range of error than normal. If you had asked me a few days ago about my opinion regarding potential polling error in one direction or another this cycle, I probably would have said something to the effect of (and in the following order):
Midterm polling in 2018 and 2022 has been fairly reliable in an era where polling has been susceptible to underrepresenting Trump/Republican support in presidential election cycles.
Something akin to Perry Bacon’s argument that, compared to 2018, we are headed for a blowout at that level (and to be clear, it is really, really hard to get beyond an eight-point national lead!).5
Given those dynamics, there are real challenges to doing this kind of polling accurately, so we should be prepared for a scenario where polling does not match our expectations. Ben Jacobs had a great read where he talked to Zac McCrary, who had exactly the right take: “The issue is that it has never been cheaper or easier to poll the wrong way and more expensive or complicated to poll the right way.”
Moreover, national surveys are hard to make sense of because of political dynamics like redistricting and the reality that very few seats actually determine House control (if it isn’t a total blowout, that is). And state and district surveys are really expensive, have smaller sample sizes, and are often publicly released by pollsters with incentives beyond simply measuring the state of the race accurately.
Even if there were systematic polling error underestimating support for Republicans, the current generic ballot lead is probably large enough that Democrats would still likely win the House (if the error was 2020-sized or less).
All of these thoughts are in relation to the potential for systematic polling error, which is always possible. It is increasingly hard to ignore that possibility when there is almost only good news for Democrats, or when respondents enter a survey and don’t complete it, but may have wildly different attitudes on the questions they do answer. As a pollster who has lived through the last three presidential elections, the prospect of non-response bias looms large and will for the rest of my days.
The Democratic RBA versus generic ballot trend introduces a potential for bias within the composition of samples of completed interviews this year—not one between supporting Democratic candidates and Republican candidates, but one between turning out for Democrats and not turning out at all.
Democrats led Republicans in the generic ballot in the September Marquette poll by eight points, which increased to 13 points among likely voters. Similarly, the Economist/YouGov survey showing D+14 among likely voters found a smaller eight-point Democratic lead among registered voters. Turnout assumptions are always a necessary part of developing likely voter models; the question sticking with me based on this analysis is whether those assumptions are too rosy for Democrats when many people supporting them don’t have a positive view of the Democratic Party either.
At the moment, my gut tells me that the toxicity of the political environment and anger toward Trump and Republicans are more meaningful, motivating forces than discontent with the Democratic Party and its leadership in depressing turnout. Maybe all this doesn’t mean anything in the end.
That said, I am mentally anticipating a larger band of potential outcomes in my head just in case the results in November look different from the generic ballot polling we’re seeing now.
Editor’s note: this piece first appeared on the author’s Substack
Bryan Bennett is the Principal of Loft Beck Strategies, a public opinion research consultancy based in Austin, Texas. Prior to starting LBS, Bryan previously founded and ran Navigator Research from 2018–2025.
This analysis consists of 17 publicly-available surveys from public opinion research organizations conducted in July through September of the midterm elections from 2006 to 2026 that asked all three of the following questions: favorability of the Democratic Party, favorability of the Republican Party, and a generic ballot vote preference question. The surveys were conducted by Gallup, Fox, The Economist/YouGov, PRRI, Quinnipiac University, Suffolk University, the Pew Research Center, Marquette University, The Financial Times/Focaldata, and Echelon Insights.
Though some years have as few as two surveys included, their results generally mirror the broader trends on these individual metrics in other surveys asking only a subset of these questions.
Of course, 2014 was a wave election favoring Republicans in the Senate. They picked up 9 Senate seats that cycle. Also, 2014 generic ballot polling was a little weird, admittedly: Democrats held the lead in almost every generic ballot measurement over the summer, but it started to break toward Republicans in the fall, and Republicans ultimately overperformed those polls.
Of course, 2014 was a wave election favoring Republicans in the Senate. They picked up 9 Senate seats that cycle. Also, 2014 generic ballot polling was a little weird, admittedly: Democrats held the lead in almost every generic ballot measurement over the summer, but it started to break toward Republicans in the fall, and Republicans ultimately overperformed those polls.

Just concede the obvious. The Democrats are the beneficiary of an overwhelming sentiment against Trump. And it most acute in the loss of any independents or traditional Republican voters being prepared to vote for Trump governance.
This is not really an affirmation of American socialism or Anti-Semitism when the likes of El-Sayed and Talirico are so easily winning Michigan and Texas.
It is all about who is not voting Republican.
And existing Congressional Republicans only have themselves to blame. They needed to revolt against Trump on tariffs , Ukraine and corruption. But chose not to.
And now they reap the whirlwind.
The Democrats will only create gridlock and impeachment.
The US wil be ever more polarized.
No Democrat can win the 2028 nomination without holding to a line of massive socialist transformation plus overt anti-Semitism.
And they may still win, given the destruction that Trump has wrought.
“… the Democratic Party brand problems could be holding back their performance …” I don’t have the deeper understanding of how polling numbers determine anything but what I can tell you, anecdotally, is the democratic “party” is a disaster. As someone who has voted blue for quite a while it’s been because “that’s the best option” not because they represent me and my liberal leaning interests. Between Super, Corporate and AI-PAC interests to complete divestment in their constituent’s interests this party is looking as corrupt as the GOP. So I can easily see how their brand is holding back their performances.